Many analytics projects fail long before the dashboard, model, or statistical test appears. The real problem usually starts earlier, when the question being analyzed is not the question that actually matters.
A team may ask whether a marketing campaign increased conversions, when the real business concern is whether the campaign improved profitable customer behavior. A healthcare study may measure treatment response, while patients care about long-term quality of life. A machine learning model may achieve excellent predictive accuracy while optimizing for the wrong operational outcome.
The technical work can be rigorous and still lead to weak decisions because the statistical task became disconnected from the original problem. In practice, this happens far more often than obvious calculation mistakes.
I find this distinction useful because it changes how you evaluate analytics quality. Instead of asking only whether the method was implemented correctly, you start asking whether the analysis was solving the right problem in the first place.
The Most Dangerous Analytics Mistake Happens Before the Analysis
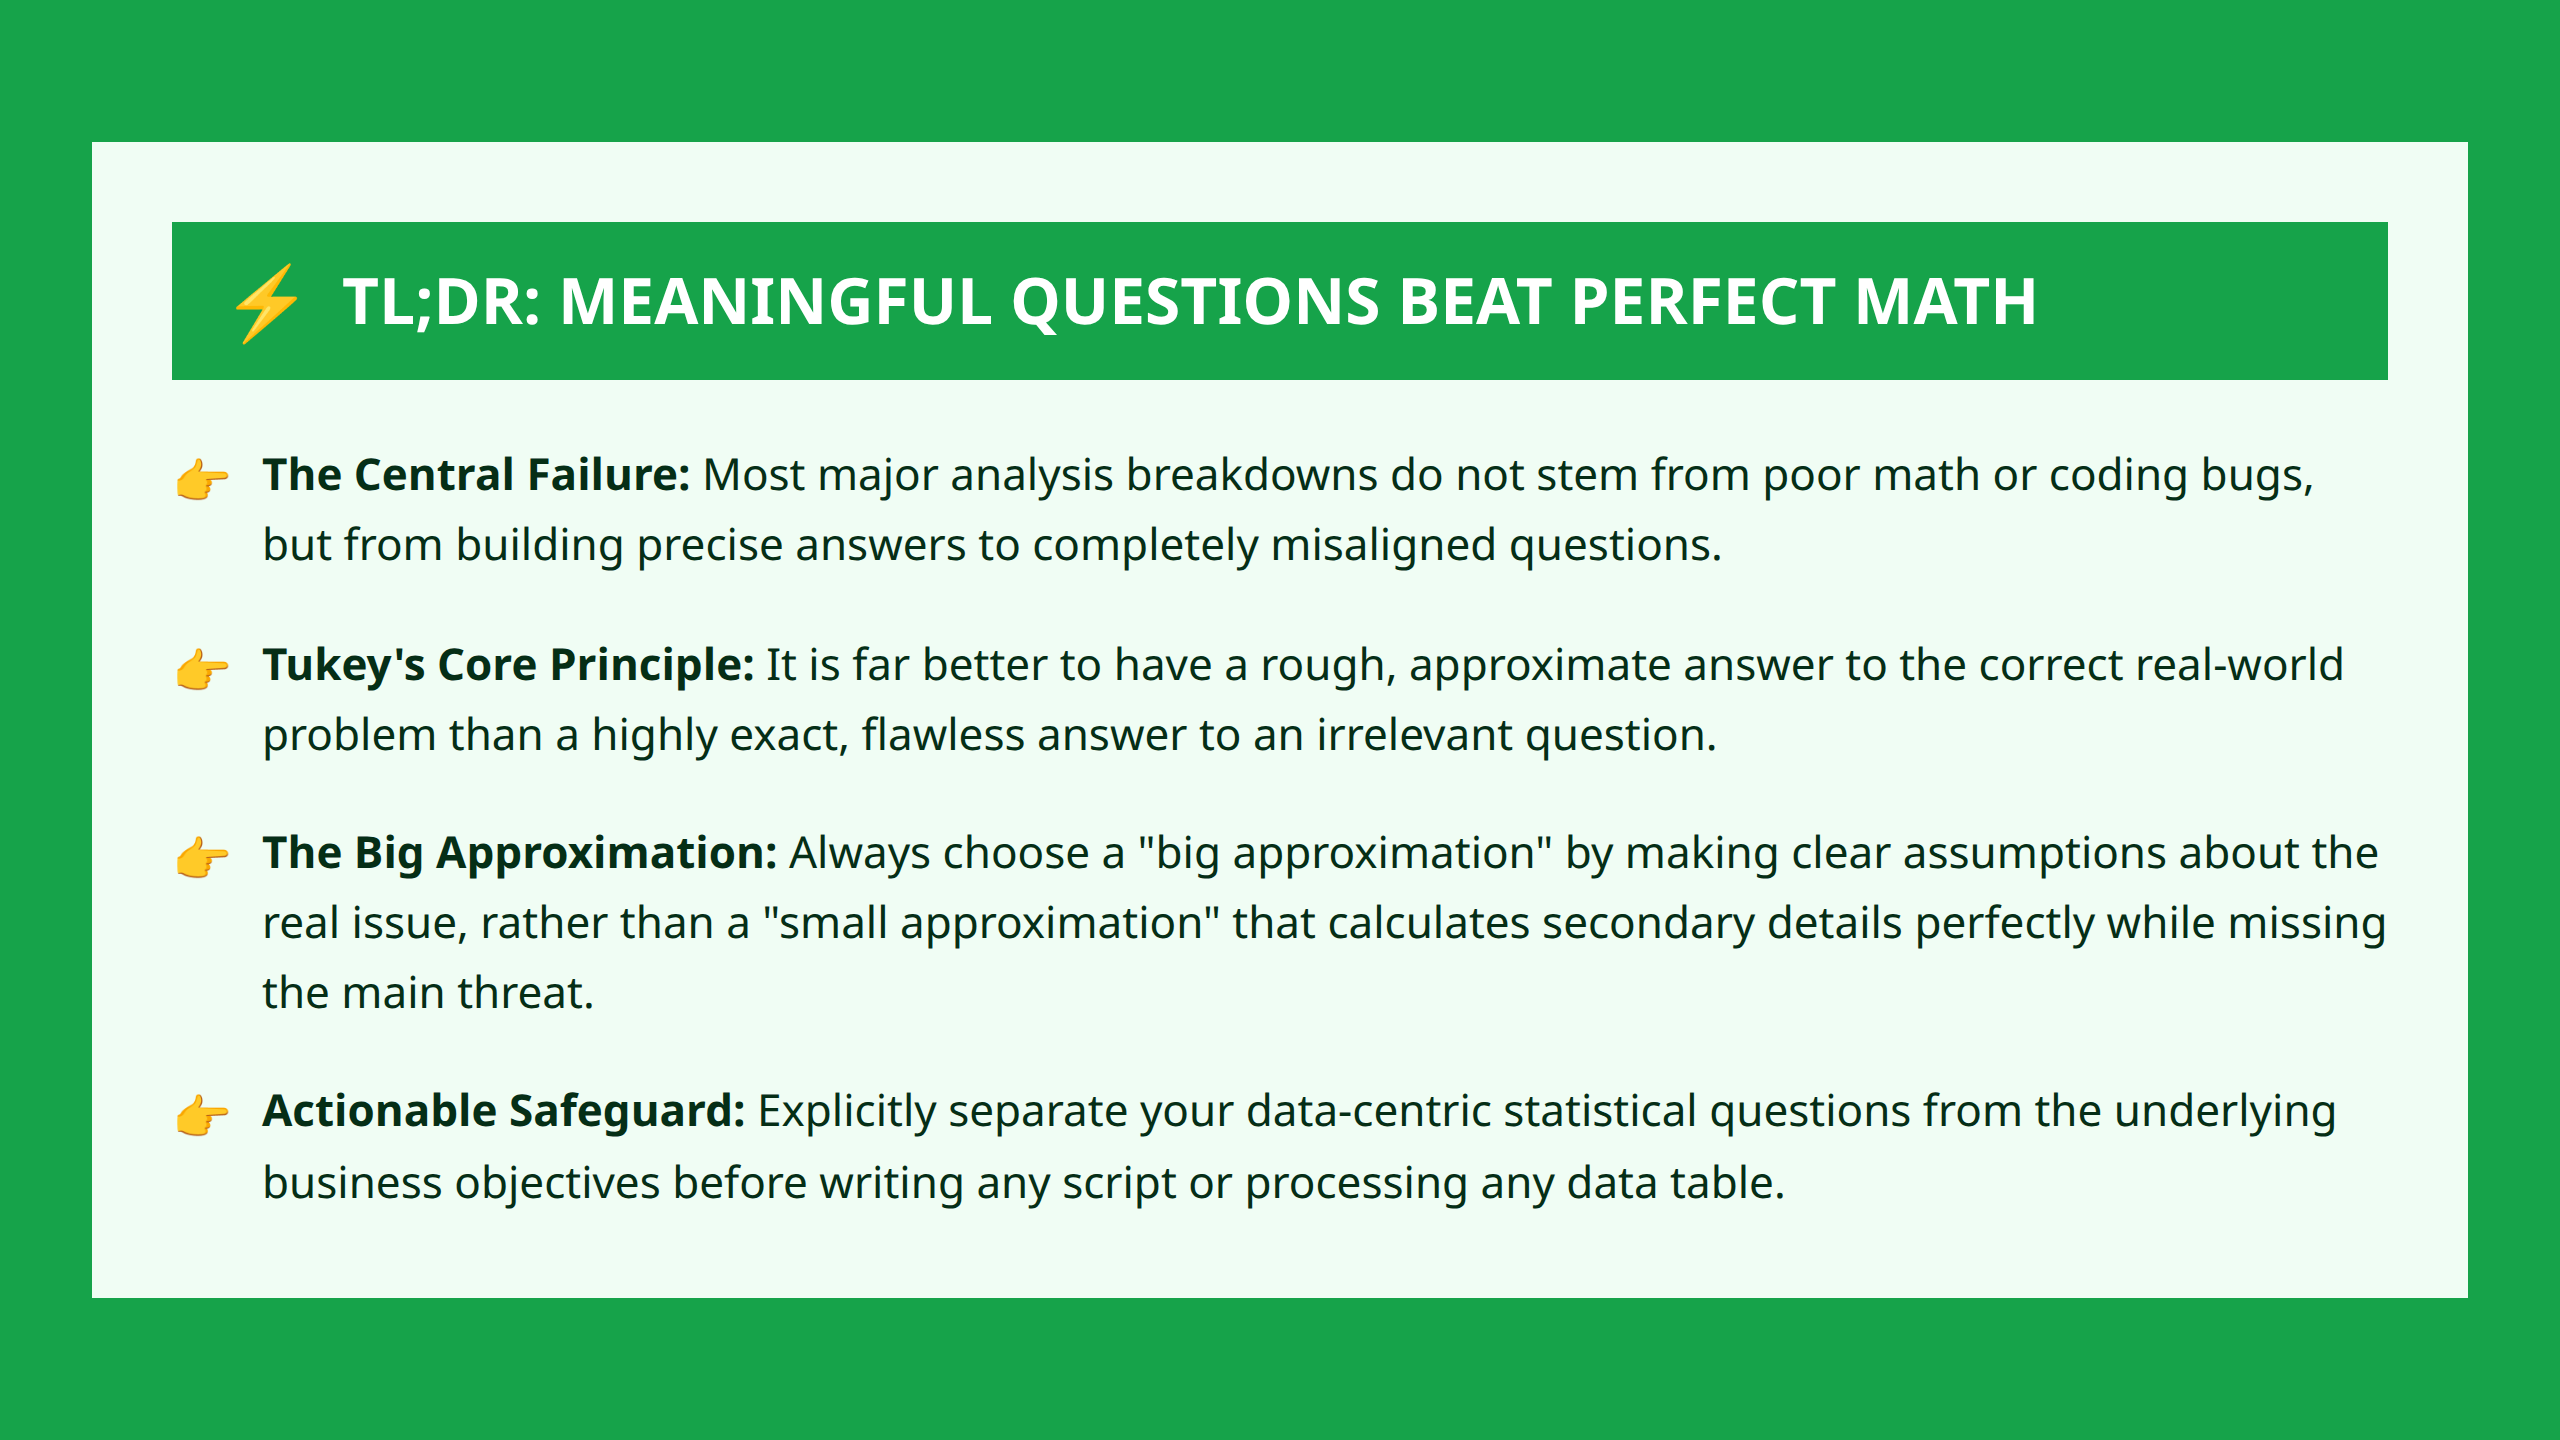
There is a common assumption in analytics that better tools automatically produce better answers. Teams invest in larger datasets, faster infrastructure, cleaner dashboards, and more sophisticated models. Those things matter, but they do not protect against a badly framed question.
A precise answer to the wrong question can be more damaging than an approximate answer to the right one. The reason is simple: precision creates confidence. Once numbers look rigorous, people stop questioning whether the analysis itself was aimed at the correct objective.
That problem appears in surprisingly ordinary situations.
- A retailer asks which store has the highest average sales, when the real concern is long-term profitability per square foot.
- A university measures student performance using test scores, while employers care more about problem-solving ability and adaptability.
- A fraud detection team optimizes detection rate without considering the operational cost of false positives.
In all three cases, the analytics may be technically correct. The issue is that the measured target is only a partial representation of the real objective.
The Gap Between the Real Question and the Statistical Question
Most real-world problems begin as broad human questions:
- Which treatment works better?
- Which customers are most valuable?
- Which hiring process is fairer?
- Which product strategy will succeed?
Those questions cannot be analyzed directly. They first need to be translated into measurable forms.
That translation step is where many problems begin.
Suppose a company asks:
“Does our training program improve employee performance?”
That sounds straightforward, but “performance” may mean:
- sales volume
- manager evaluations
- retention rate
- speed of task completion
- customer satisfaction
- promotion frequency
Each measurement leads to a different statistical problem. More importantly, each measurement can produce a different answer.
The analytical challenge is not merely technical. It is interpretive. The real task is deciding which measurable representation best captures the underlying objective.
This is where analytics often becomes deceptively fragile. Once a measurable variable exists, teams tend to treat it as if it fully represents reality. But the measurement is only a proxy.
The “Big Approximation” Most Teams Ignore
A useful way to think about analytics is to separate two different approximations.
The first approximation is the difficult one: translating the real-world problem into a statistical formulation. The second approximation is the technical one: solving that statistical problem using models, assumptions, and methods.
Most analytics education focuses heavily on the second part.
People learn:
- how to run regressions
- how to train classifiers
- how to optimize models
- how to evaluate significance
- how to reduce variance
Those skills matter. But they mostly operate after the problem definition has already been chosen.
The larger risk often sits earlier in the process. If the wrong measurable target is selected, excellent technical execution simply produces a cleaner version of the wrong answer.
I would think about it this way: advanced analytics cannot rescue a weak question. In some situations, sophisticated modeling actually hides the weakness because the output appears more authoritative.
Why Powerful Analytics Tools Make This Problem Worse
Modern analytics systems reduce friction dramatically. Models that once required weeks of work can now be executed in minutes using Python, R, SQL pipelines, AutoML systems, or cloud platforms.
That convenience has obvious benefits, but it also changes behavior.
When analysis becomes extremely easy to run, teams spend less time questioning whether the analysis should exist in its current form.
Years ago, complicated statistical calculations required enough effort that analysts were forced to think carefully before starting. Today, experimentation is nearly frictionless. A team can generate dashboards, compare metrics, run significance tests, and deploy models rapidly.
The danger is not speed itself. The danger is skipping the conceptual stage.
Machine learning systems make this especially visible. A model may optimize prediction accuracy while completely ignoring whether the prediction target matches the organization’s real objective.
For example:
| Operational Goal | What Gets Measured Instead | Potential Problem |
|---|---|---|
| Improve healthcare outcomes | Healthcare spending | Cost is not identical to health |
| Improve hiring quality | Past employee ratings | Historical bias becomes embedded |
| Increase customer loyalty | Short-term engagement | Engagement may not predict retention |
In each case, the measurable target only partially captures the underlying goal.
How Analytical Precision Creates False Confidence
One reason this problem is difficult to detect is that technical rigor feels reassuring.
Confidence intervals, p-values, dashboards, model evaluation metrics, and predictive accuracy all create a sense of scientific reliability. But those outputs only evaluate the statistical question that was chosen. They do not automatically validate whether the chosen question was meaningful.
This distinction becomes critical in decision-making environments.
A company may spend months optimizing a KPI that turns out to have weak connection to long-term business performance. The analytics team may still appear successful because the KPI itself improved.
This is one of the easiest traps to fall into in business intelligence work. Once a metric becomes operationalized, organizations start optimizing the metric instead of the real-world objective behind it.
The issue is not dishonesty. It is substitution. The measurable target quietly replaces the original goal.
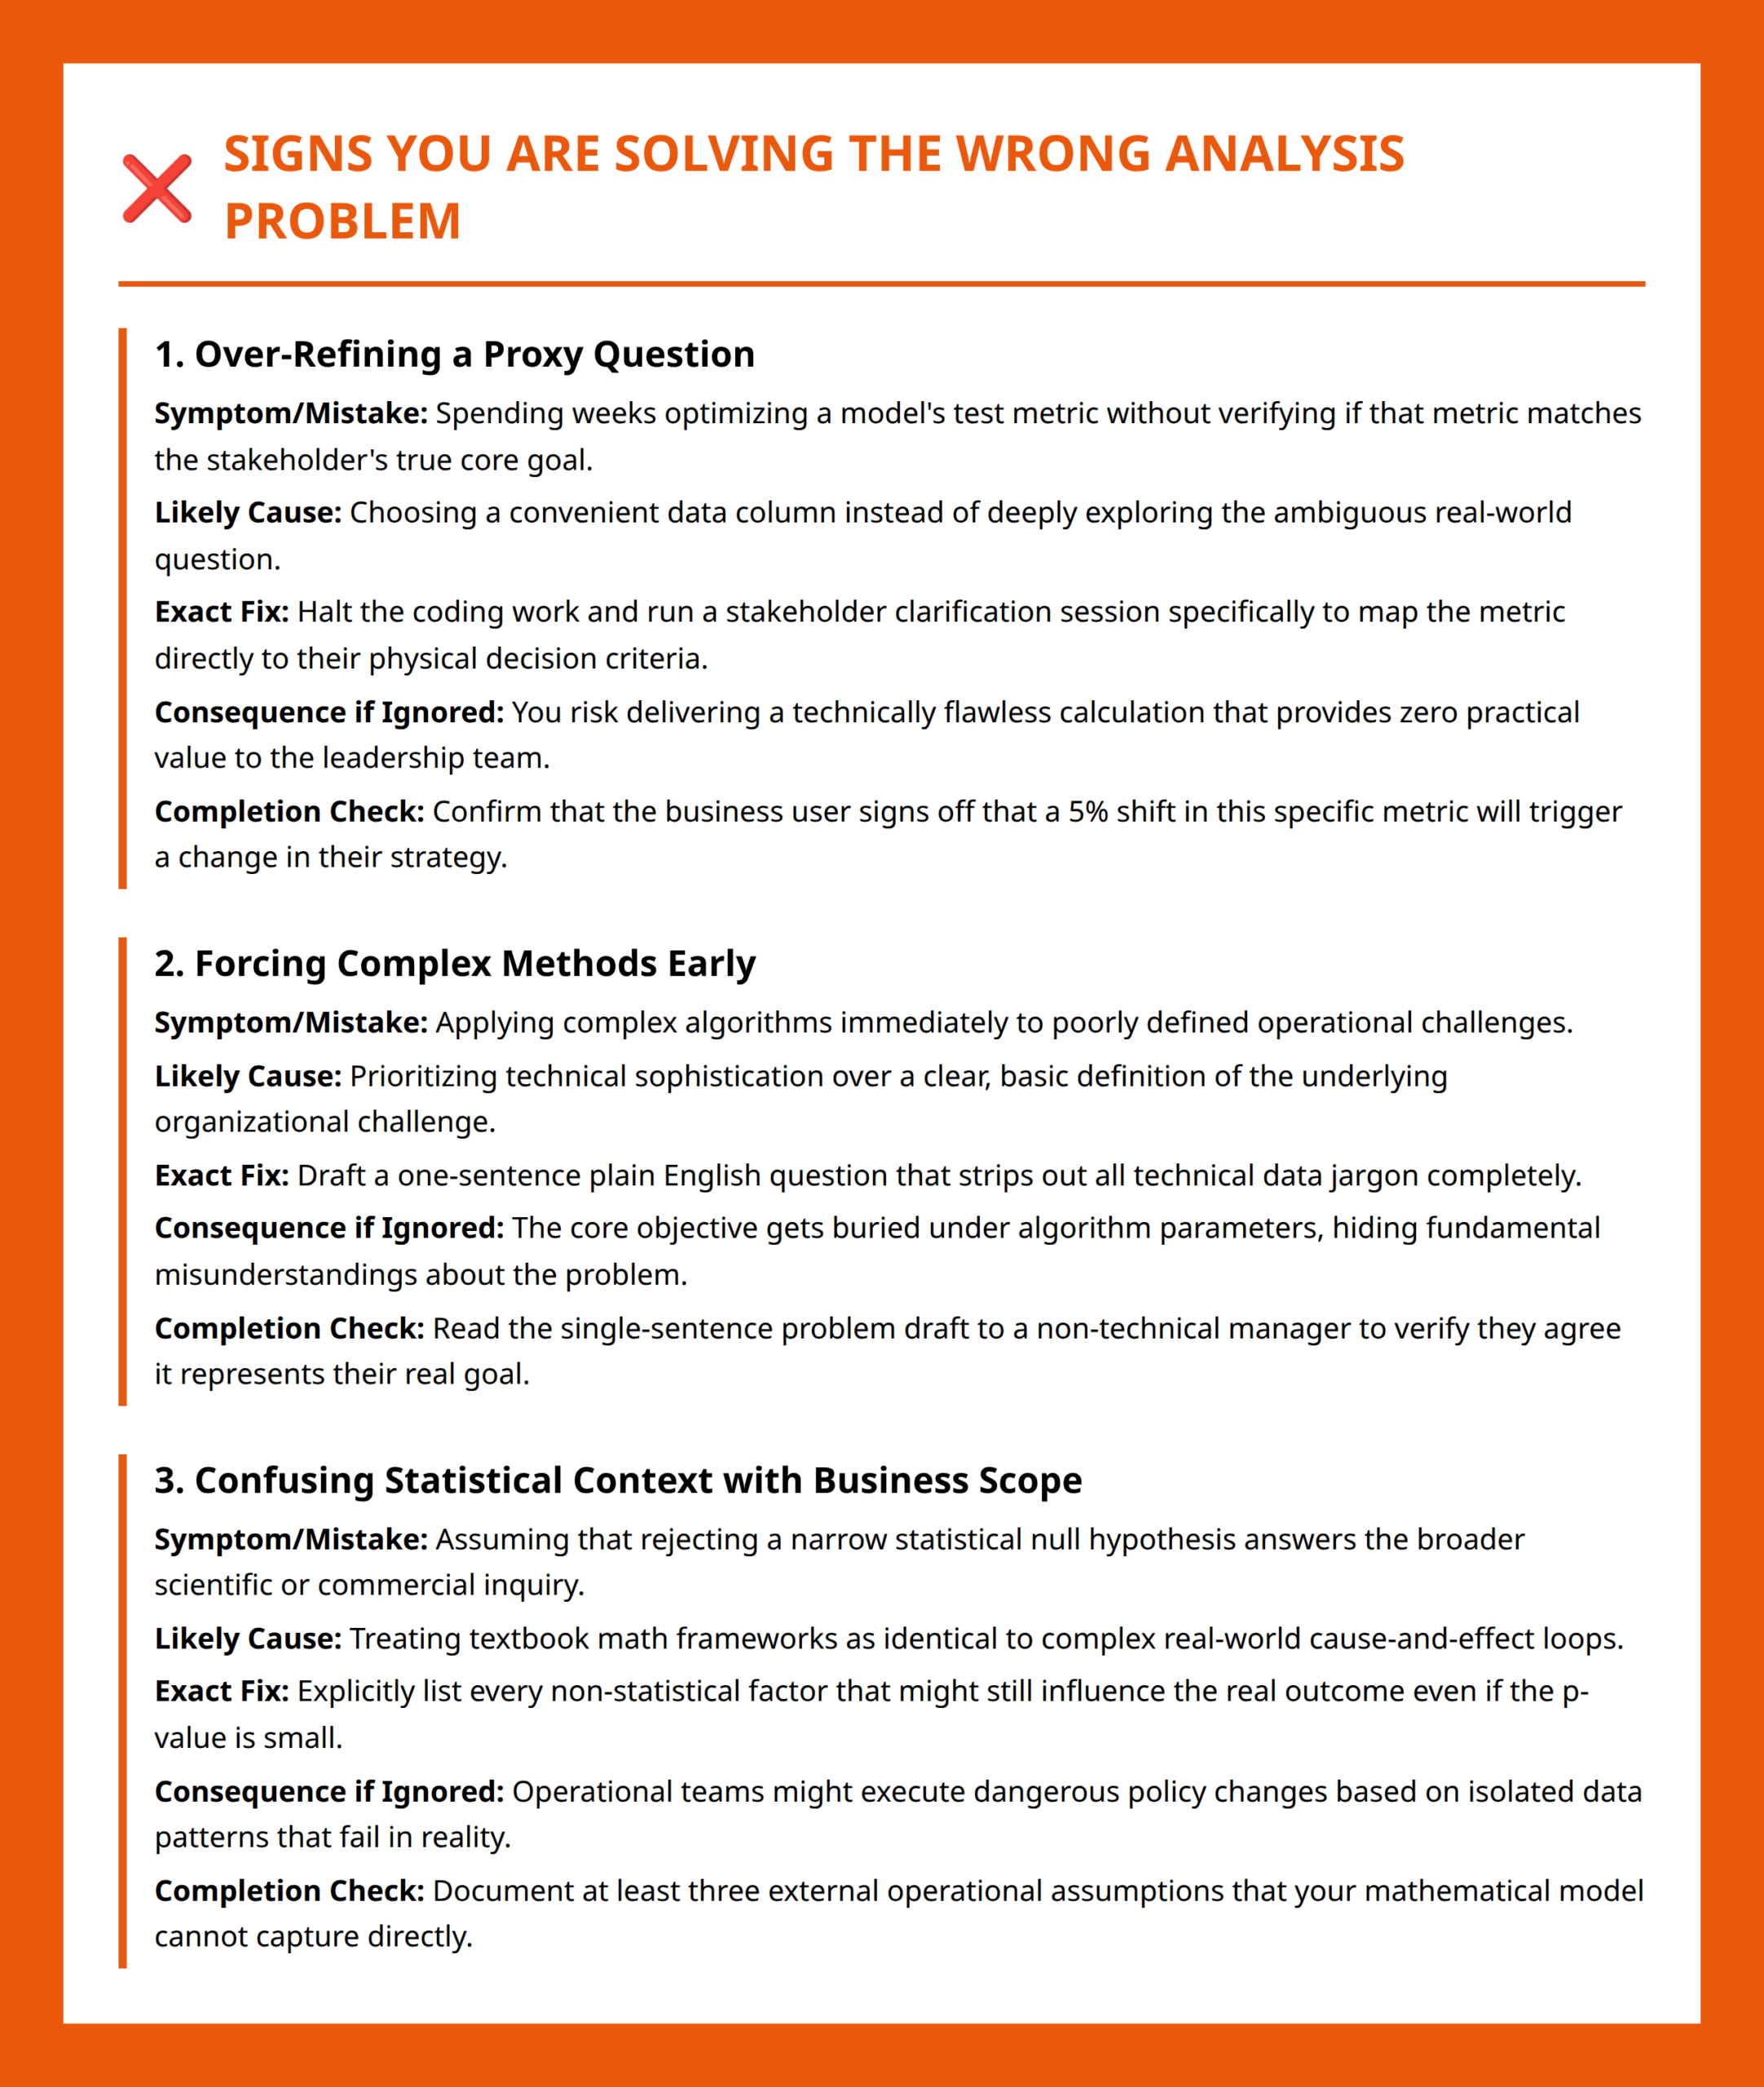
Three Warning Signs That the Analysis May Be Misaligned
1. The Metric Is Easier to Measure Than the Real Objective
This is extremely common. Teams often select variables because they are available, not because they are conceptually ideal.
For example, measuring customer support success through ticket closure time is easy. Measuring actual customer resolution quality is much harder.
Easy measurement is not automatically wrong, but it should trigger caution.
2. Different Stakeholders Mean Different Things by the Same Word
Terms like “performance,” “quality,” “engagement,” “fairness,” and “risk” often hide multiple interpretations.
If stakeholders would define success differently, the analytical target probably needs clarification before modeling begins.
3. The Team Debates Methods Before Agreeing on Objectives
I see this frequently in technical environments. Teams immediately discuss algorithms, dashboards, or model architecture while the actual decision objective remains vague.
That usually indicates the statistical task has become detached from the original business problem.
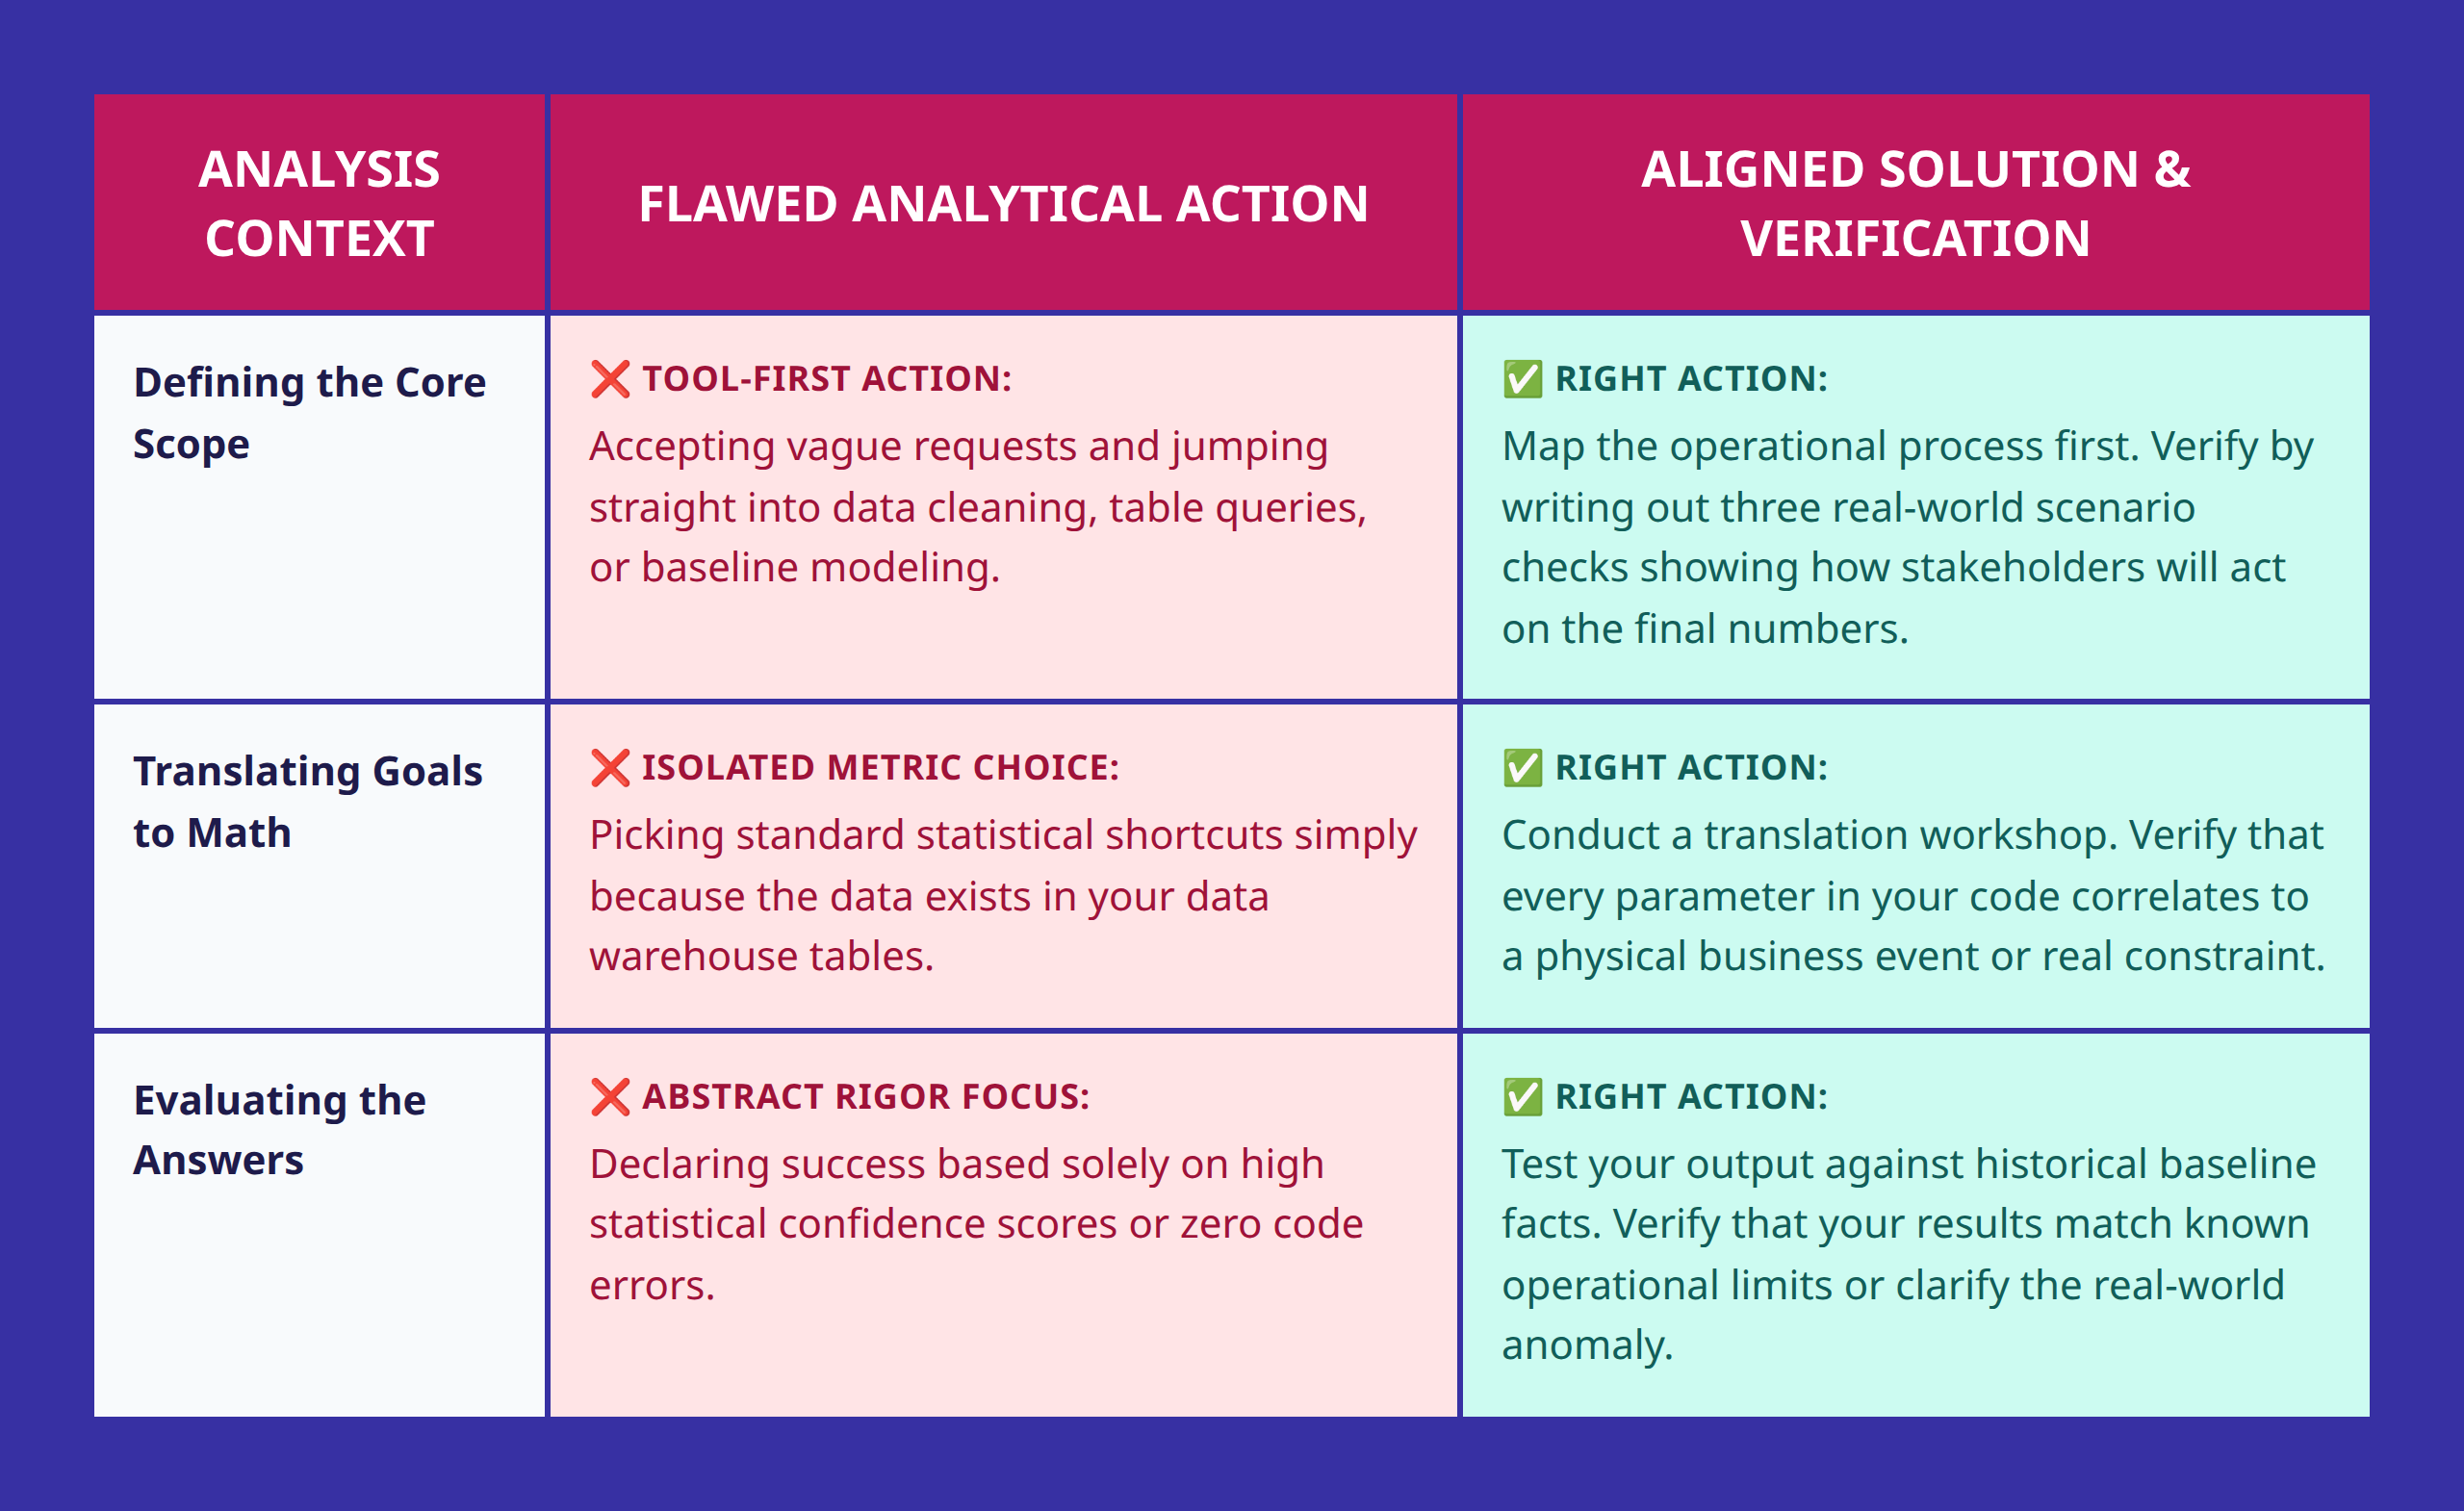
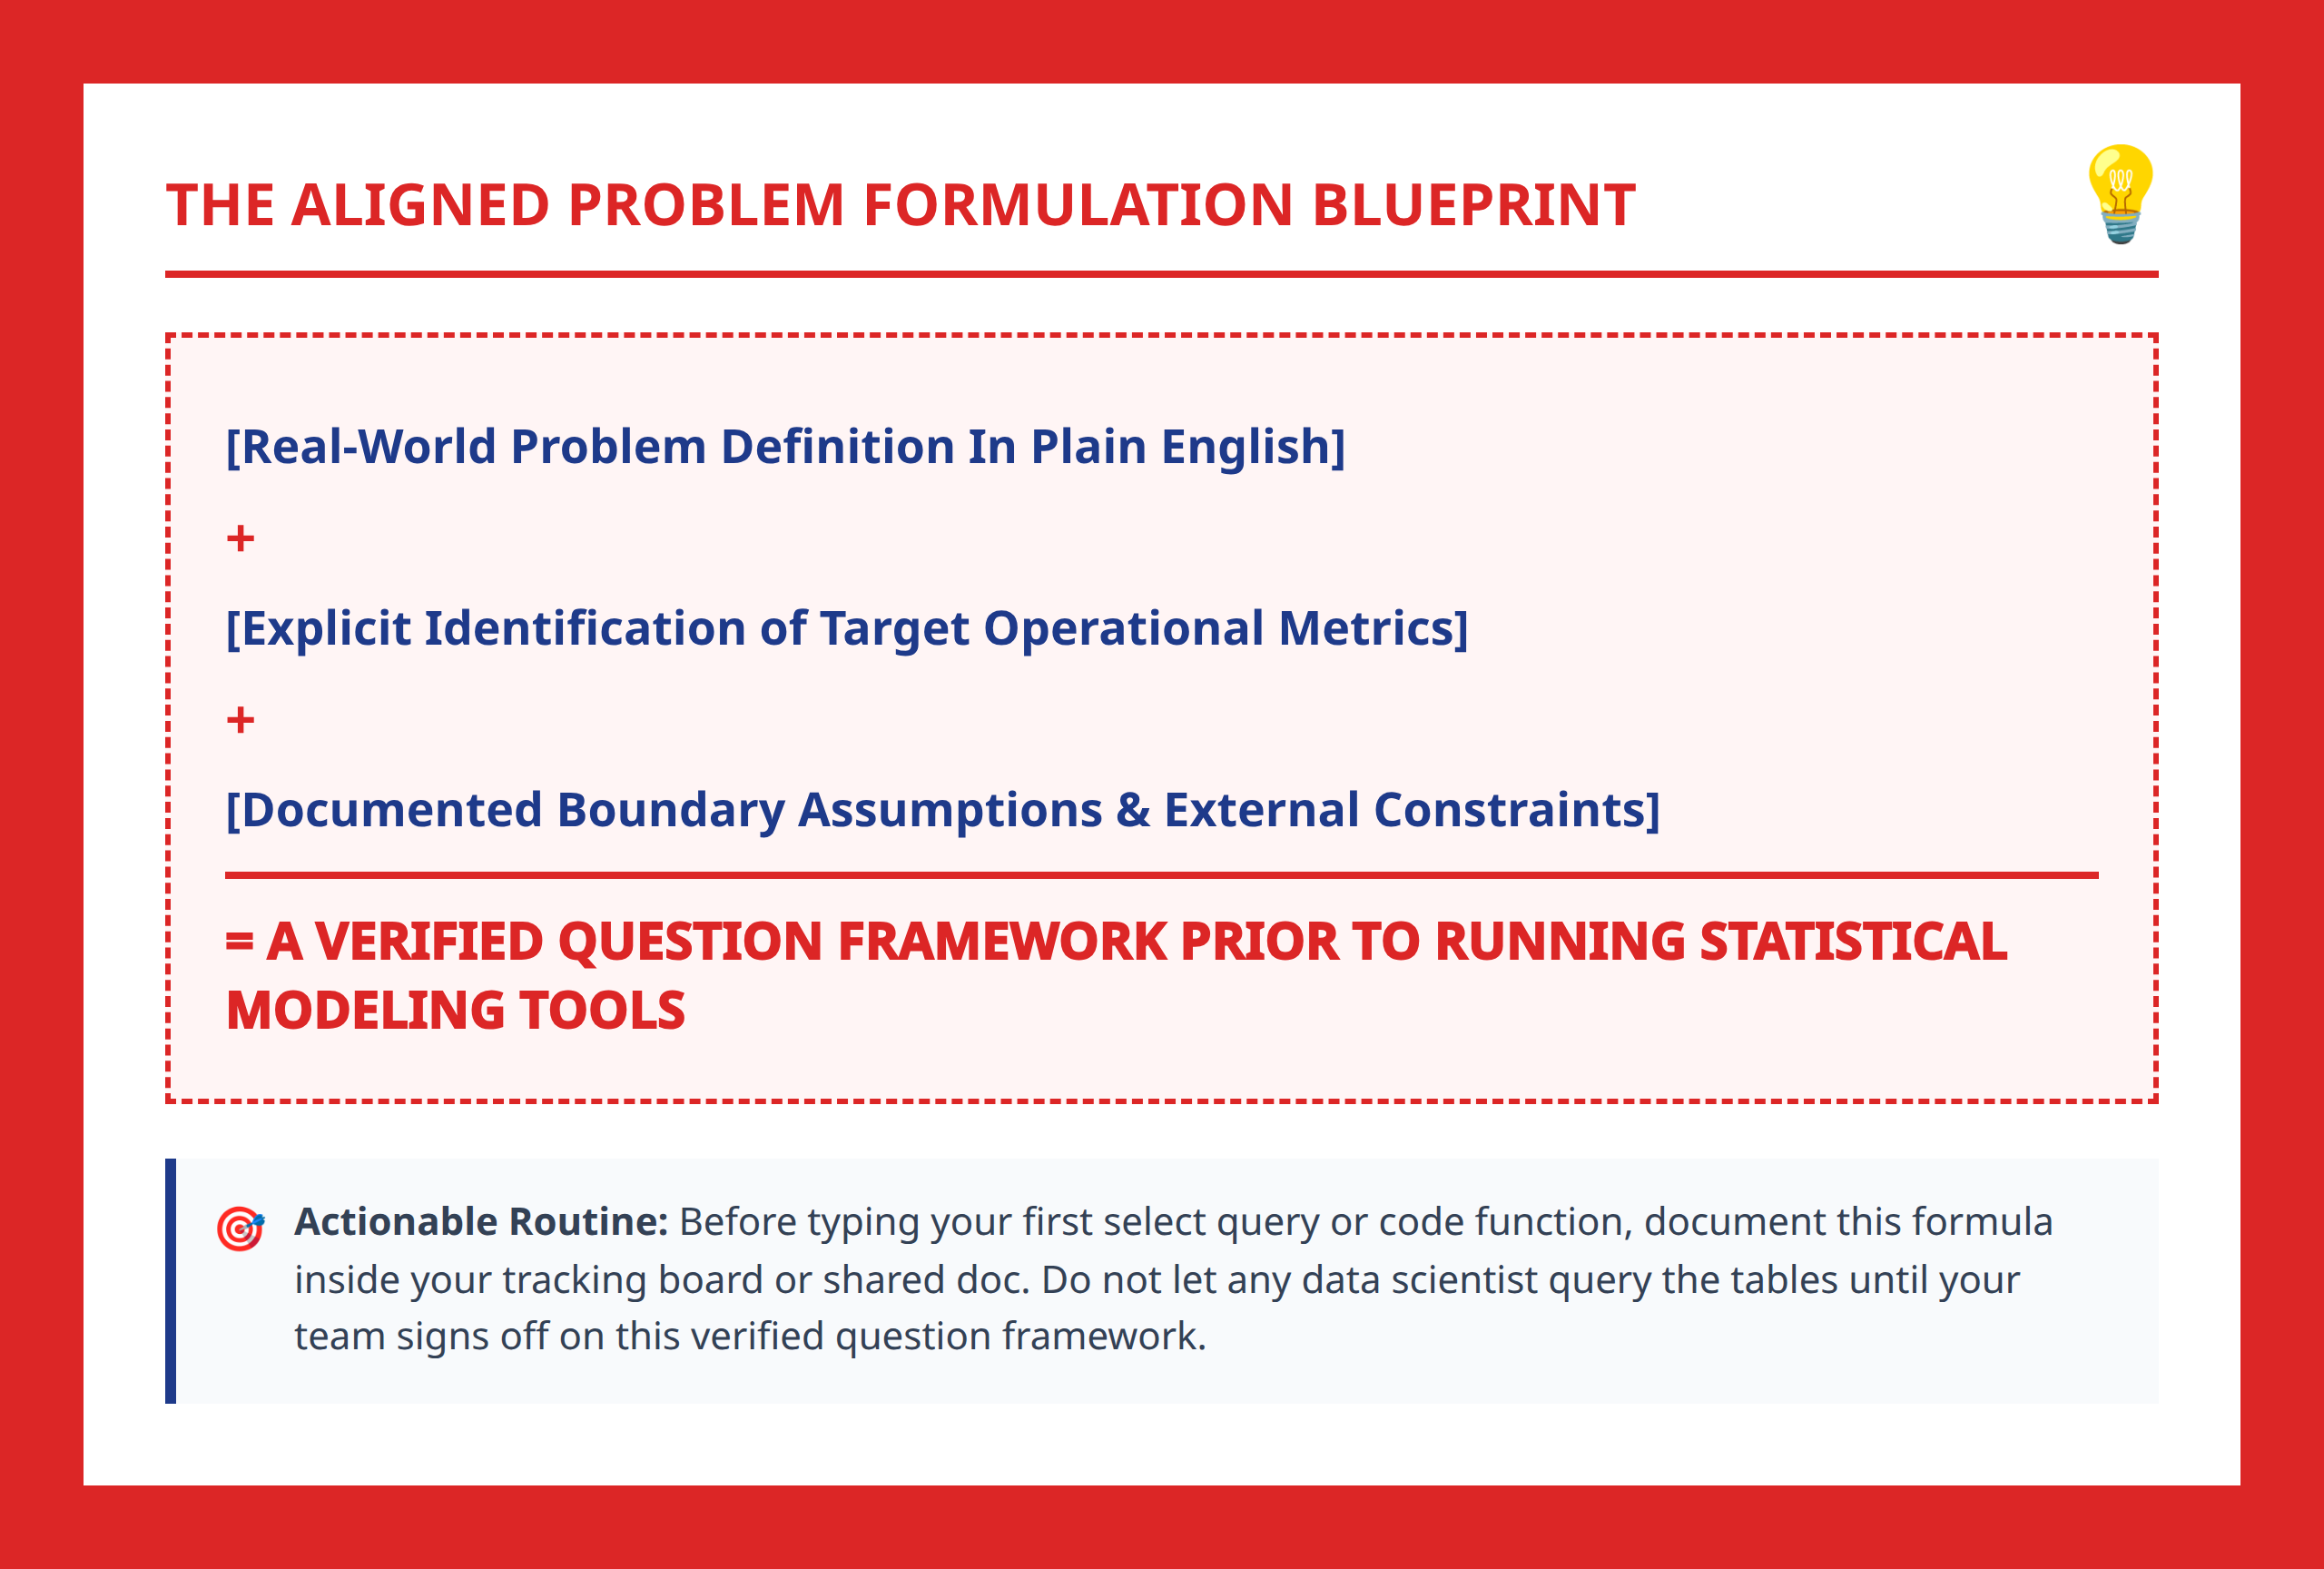
A Practical Framework Before Running Any Analysis
Before building a model or starting formal analysis, ask these five questions:
- What real-world decision will this analysis influence?
- What exact question are we trying to answer?
- Which measurable variable represents that question?
- What important parts of reality does that variable ignore?
- Could another measurement lead to a meaningfully different conclusion?
Those questions sound simple, but they force teams to examine the translation layer between business reality and statistical representation.
That translation layer is where many analytics failures begin.
Good Analytics Starts With Better Questions
Strong analytics is not only about choosing better methods. It is about choosing better representations of the problem itself.
The hardest part of data analysis is often not computational. It is conceptual. The challenge is deciding what you actually want to know before turning it into numbers.
Once the wrong measurable target becomes embedded in dashboards, reports, or models, the organization may optimize toward outcomes that only resemble success statistically.
The practical lesson is surprisingly simple: spend more time questioning the question. A slower start usually produces better analysis, better decisions, and fewer expensive surprises later.
References:
- https://www.youtube.com/watch?v=LZGP5EE-bcU
- https://www.youtube.com/watch?v=WfjgyvCPFnA
- https://www.youtube.com/watch?v=-efz-CVpE34
- https://www.reddit.com/r/dataanalysis/comments/11h37hg/whats_your_hack_to_avoid_errors_in_your_analysis/
- https://www.reddit.com/r/dataanalysis/comments/11h37hg/whats_your_hack_to_avoid_errors_in_your_analysis/jariom8/
- https://www.reddit.com/r/dataanalysis/comments/18lwz9z/how_to_avoid_fuck_ups/
- https://www.reddit.com/r/dataanalysis/comments/1s0lcz1/how_can_i_improve_my_problemsolving_skills_and/
- https://www.reddit.com/r/statistics/comments/1e2xa3i/q_how_do_you_deal_with_the_fear_of_making/
- https://www.reddit.com/r/statistics/comments/1e2xa3i/comment/ld43riz/
- https://www.reddit.com/r/statistics/comments/1e2xa3i/comment/ld4520v/
- https://www.linkedin.com/posts/samirsharma1_stop-starting-with-data-because-you-are-activity-7390704225673957376-HvYA
- https://www.linkedin.com/posts/gauravowlcity_problemsolving-sql-analytics-activity-7342416048366723072-bwxw
- https://smrtr.com.au/news-views/3-most-common-data-analytics-mistakes-and-how-to-avoid-them/
- https://www.kaizenko.com/five-whys-root-cause-analysis-stop-solving-the-wrong-problems/
- https://www.datascience-pm.com/project-failures/
- https://newsletter.rafapaez.com/p/stop-solving-the-wrong-problem
- https://www.linkedin.com/pulse/solving-wrong-problem-common-trap-how-avoid-summer-miller-edd-kuxhc
- https://medium.com/@vprash360/dont-solve-wrong-problem-8b8cc2aff987
- https://towardsdatascience.com/the-5-efficient-ways-to-find-and-resolve-data-issues-318e294f2e3a/
- https://www.reddit.com/r/statistics/comments/1e2xa3i/q_how_do_you_deal_with_the_fear_of_making/ld4rur5/
- https://getledgr.co/2025/03/04/how-to-handle-discrepancies-and-errors-in-your-financial-records/
- https://www.linkedin.com/advice/3/youre-data-analyst-who-wants-improve-your-problem-solving-y6qkc